Mean orientation per grain#
In this notebook, we wiil see how to extract the average orientation per grain.
Both orientation data and grain segmentation (microstructure) data are required.
import xarrayaita.loadData_aita as lda #here are some function to build xarrayaita structure
import xarrayaita.aita as xa
import xarrayuvecs.uvecs as xu
import xarrayuvecs.lut2d as lut2d

import matplotlib.pyplot as plt
import matplotlib.cm as cm
import numpy as np
import scipy
Load your data#
# path to orientation data and microstructure
path_data='orientation_test.dat'
path_micro='micro_test.bmp'
data=lda.aita5col(path_data,path_micro)
data
<xarray.Dataset> Size: 100MB
Dimensions:      (y: 2500, x: 1000, uvecs: 2)
Coordinates:
  * x            (x) float64 8kB 0.0 0.02 0.04 0.06 ... 19.92 19.94 19.96 19.98
  * y            (y) float64 20kB 49.98 49.96 49.94 49.92 ... 0.06 0.04 0.02 0.0
Dimensions without coordinates: uvecs
Data variables:
    orientation  (y, x, uvecs) float64 40MB 2.395 0.6451 5.377 ... 0.6098 0.6473
    quality      (y, x) int64 20MB 0 90 92 93 92 92 94 ... 96 96 96 96 97 97 96
    micro        (y, x) float64 20MB 0.0 0.0 0.0 0.0 0.0 ... 0.0 0.0 0.0 0.0 0.0
    grainId      (y, x) int64 20MB 1 1 1 1 1 1 1 1 1 1 1 ... 1 1 1 1 1 1 1 1 1 1
Attributes:
    date:       b'Thursday, 19 Nov 2015, 11:24 am\r'
    unit:       millimeters
    step_size:  0.02
path_dat: orientation_test.datFilter the data#
data.aita.filter(75)
The average orientation#
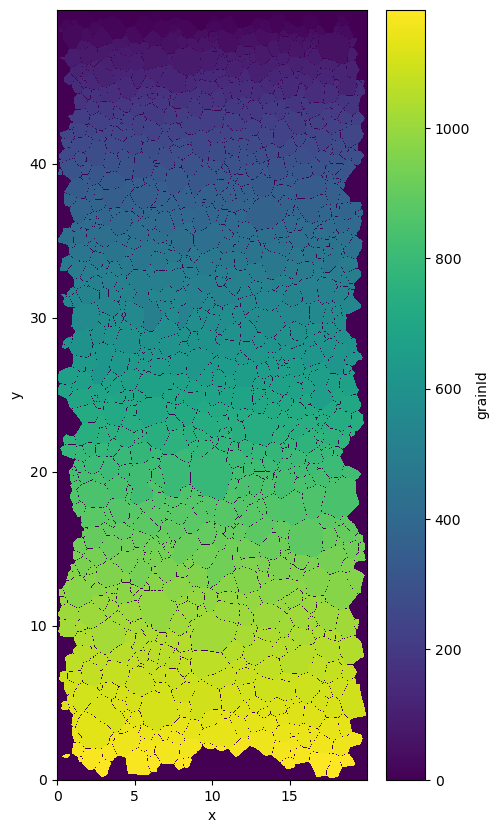
The definition of the grain is based on the corresponding value from the grainId variable. Therefore one grain corresponds to all pixels with the same grainId label.
plt.figure(figsize=(5,10))
data.grainId.plot()
<matplotlib.collections.QuadMesh at 0x7f25d9e5a710>
The “average” orientation is defined as the main eigen vector of the second order orientation tensor (see uvecs.OT2nd). And can be computed with aita.mean_grain.
help(xa.aita.mean_grain)
---------------------------------------------------------------------------
AttributeError Traceback (most recent call last)
Cell In[7], line 1
----> 1 help(xa.aita.mean_grain)
AttributeError: type object 'aita' has no attribute 'aita'
data['orientation_mg']=data.aita.mean_grain()
The output#
data
<xarray.Dataset>
Dimensions: (uvecs: 2, x: 1000, y: 2500)
Coordinates:
* x (x) float64 0.0 0.02 0.04 0.06 ... 19.92 19.94 19.96 19.98
* y (y) float64 49.98 49.96 49.94 49.92 ... 0.06 0.04 0.02 0.0
Dimensions without coordinates: uvecs
Data variables:
orientation (y, x, uvecs) float64 nan nan 5.377 ... 0.6395 0.6098 0.6473
quality (y, x) int64 0 90 92 93 92 92 94 94 ... 96 96 96 96 97 97 96
micro (y, x) float64 0.0 0.0 0.0 0.0 0.0 ... 0.0 0.0 0.0 0.0 0.0
grainId (y, x) int64 1 1 1 1 1 1 1 1 1 1 1 ... 1 1 1 1 1 1 1 1 1 1 1
orientation_mg (y, x, uvecs) float64 -0.662 0.884 -0.662 ... -0.662 0.884
Attributes:
date: Thursday, 19 Nov 2015, 11:24 am
unit: millimeters
step_size: 0.02
path_dat: orientation_test.datxarray.Dataset
- uvecs: 2
- x: 1000
- y: 2500
- x(x)float640.0 0.02 0.04 ... 19.94 19.96 19.98
array([ 0. , 0.02, 0.04, ..., 19.94, 19.96, 19.98])
- y(y)float6449.98 49.96 49.94 ... 0.04 0.02 0.0
array([4.998e+01, 4.996e+01, 4.994e+01, ..., 4.000e-02, 2.000e-02, 0.000e+00])
- orientation(y, x, uvecs)float64nan nan 5.377 ... 0.6098 0.6473
array([[[ nan, nan], [5.37718489, 1.04999008], [5.38905313, 1.05627326], ..., [ nan, nan], [5.65731024, 0.94160513], [5.68523551, 1.03218772]], [[5.35955707, 1.15837502], [5.35885894, 1.12975162], [5.3613024 , 1.11701072], ..., [ nan, nan], [5.64753639, 0.94073247], [5.67912685, 1.04143796]], [[5.36304773, 1.23045712], [5.36165146, 1.23132979], [ nan, nan], ..., ... ..., [0.62378067, 0.625526 ], [0.61784656, 0.61994095], [0.61645029, 0.61400683]], [[0.68085294, 1.12399204], [0.68050388, 1.12730816], [0.67840948, 1.13900187], ..., [0.64123397, 0.62954026], [0.62430427, 0.63529985], [0.61575216, 0.62203535]], [[0.67701322, 1.13236962], [0.67753682, 1.13690747], [0.67840948, 1.13149695], ..., [0.63652158, 0.61418136], [0.61645029, 0.63948864], [0.60981804, 0.64734262]]]) - quality(y, x)int640 90 92 93 92 92 ... 96 96 97 97 96
array([[ 0, 90, 92, ..., 0, 85, 90], [81, 82, 83, ..., 0, 84, 89], [81, 80, 3, ..., 0, 79, 88], ..., [90, 91, 91, ..., 95, 95, 95], [91, 92, 91, ..., 95, 95, 95], [92, 92, 91, ..., 97, 97, 96]]) - micro(y, x)float640.0 0.0 0.0 0.0 ... 0.0 0.0 0.0 0.0
array([[0., 0., 0., ..., 0., 0., 0.], [0., 0., 0., ..., 0., 0., 0.], [0., 0., 0., ..., 0., 0., 0.], ..., [0., 0., 0., ..., 0., 0., 0.], [0., 0., 0., ..., 0., 0., 0.], [0., 0., 0., ..., 0., 0., 0.]]) - grainId(y, x)int641 1 1 1 1 1 1 1 ... 1 1 1 1 1 1 1 1
array([[1, 1, 1, ..., 1, 1, 1], [1, 1, 1, ..., 1, 1, 1], [1, 1, 1, ..., 1, 1, 1], ..., [1, 1, 1, ..., 1, 1, 1], [1, 1, 1, ..., 1, 1, 1], [1, 1, 1, ..., 1, 1, 1]]) - orientation_mg(y, x, uvecs)float64-0.662 0.884 ... -0.662 0.884
array([[[-0.66201007,  0.88398576],
        [-0.66201007,  0.88398576],
        [-0.66201007,  0.88398576],
        ...,
        [-0.66201007,  0.88398576],
        [-0.66201007,  0.88398576],
        [-0.66201007,  0.88398576]],

       [[-0.66201007,  0.88398576],
        [-0.66201007,  0.88398576],
        [-0.66201007,  0.88398576],
        ...,
        [-0.66201007,  0.88398576],
        [-0.66201007,  0.88398576],
        [-0.66201007,  0.88398576]],

       [[-0.66201007,  0.88398576],
        [-0.66201007,  0.88398576],
        [-0.66201007,  0.88398576],
        ...,
...
        ...,
        [-0.66201007,  0.88398576],
        [-0.66201007,  0.88398576],
        [-0.66201007,  0.88398576]],

       [[-0.66201007,  0.88398576],
        [-0.66201007,  0.88398576],
        [-0.66201007,  0.88398576],
        ...,
        [-0.66201007,  0.88398576],
        [-0.66201007,  0.88398576],
        [-0.66201007,  0.88398576]],

       [[-0.66201007,  0.88398576],
        [-0.66201007,  0.88398576],
        [-0.66201007,  0.88398576],
        ...,
        [-0.66201007,  0.88398576],
        [-0.66201007,  0.88398576],
        [-0.66201007,  0.88398576]]])
- date :
- Thursday, 19 Nov 2015, 11:24 am
- unit :
- millimeters
- step_size :
- 0.02
- path_dat :
- orientation_test.dat
data.orientation_mg is an orientation xarray.DataArray that have the same properties than the original orientation. Therefore all uvecs function can be use safely on this xarray.DataArray.
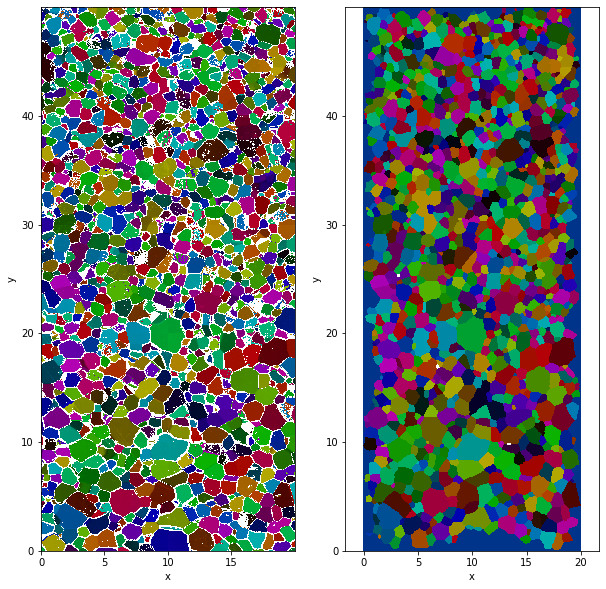
Plot colormap#
You can compute colormap for both orientation and orientation_mg
data['f_map']=data.orientation.uvecs.calc_colormap()
data['f_map_mg']=data.orientation_mg.uvecs.calc_colormap()
plt.figure(figsize=(10,10))
plt.subplot(121)
data.f_map.plot.imshow()
plt.subplot(122)
data.f_map_mg.plot.imshow()
plt.axis('equal')
Clipping input data to the valid range for imshow with RGB data ([0..1] for floats or [0..255] for integers).
Clipping input data to the valid range for imshow with RGB data ([0..1] for floats or [0..255] for integers).
(-0.01, 19.990000000000002, -0.010000000000001563, 49.99000000000001)