Misorientation angle distribution#
Definition#
The misorientation angle distribution is the PDF of all misorientation angles around pixels. Four misorientations angles are defined for each pixel, one for each neighboor.
import xarrayaita.loadData_aita as lda #here are some function to build xarrayaita structure
import xarrayaita.aita as xa
import xarrayuvecs.uvecs as xu
import xarrayuvecs.lut2d as lut2d

import matplotlib.pyplot as plt
import matplotlib.cm as cm
import numpy as np
import scipy
Load your data#
# path to data and microstructure
path_data='orientation_test.dat'
path_micro='micro_test.bmp'
data=lda.aita5col(path_data,path_micro)
data
<xarray.Dataset> Size: 100MB
Dimensions:      (y: 2500, x: 1000, uvecs: 2)
Coordinates:
  * x            (x) float64 8kB 0.0 0.02 0.04 0.06 ... 19.92 19.94 19.96 19.98
  * y            (y) float64 20kB 49.98 49.96 49.94 49.92 ... 0.06 0.04 0.02 0.0
Dimensions without coordinates: uvecs
Data variables:
    orientation  (y, x, uvecs) float64 40MB 2.395 0.6451 5.377 ... 0.6098 0.6473
    quality      (y, x) int64 20MB 0 90 92 93 92 92 94 ... 96 96 96 96 97 97 96
    micro        (y, x) float64 20MB 0.0 0.0 0.0 0.0 0.0 ... 0.0 0.0 0.0 0.0 0.0
    grainId      (y, x) int64 20MB 1 1 1 1 1 1 1 1 1 1 1 ... 1 1 1 1 1 1 1 1 1 1
Attributes:
    date:       b'Thursday, 19 Nov 2015, 11:24 am\r'
    unit:       millimeters
    step_size:  0.02
path_dat: orientation_test.datFilter the data#
data.aita.filter(75)
Performed xa.aita.mean_grain#
Depending of your application you can performed xa.aita.mean_grain.
data['orientation_mg']=data.aita.mean_grain()
Compute mis-orientation angle#
Compute ordered mis-orientation#
data['misod_mg']=data.orientation_mg.uvecs.mis_angle()
The strucure of the xarray.DataArray output#
data
<xarray.Dataset> Size: 220MB
Dimensions:         (y: 2500, x: 1000, uvecs: 2, misAngle: 4)
Coordinates:
  * x               (x) float64 8kB 0.0 0.02 0.04 0.06 ... 19.94 19.96 19.98
  * y               (y) float64 20kB 49.98 49.96 49.94 49.92 ... 0.04 0.02 0.0
Dimensions without coordinates: uvecs, misAngle
Data variables:
    orientation     (y, x, uvecs) float64 40MB nan nan 5.377 ... 0.6098 0.6473
    quality         (y, x) int64 20MB 0 90 92 93 92 92 94 ... 96 96 96 97 97 96
    micro           (y, x) float64 20MB 0.0 0.0 0.0 0.0 0.0 ... 0.0 0.0 0.0 0.0
    grainId         (y, x) int64 20MB 1 1 1 1 1 1 1 1 1 1 ... 1 1 1 1 1 1 1 1 1
    orientation_mg  (y, x, uvecs) float64 40MB -0.662 0.884 ... -0.662 0.884
    misod_mg        (y, x, misAngle) float64 80MB nan nan nan ... nan nan nan
Attributes:
    date:       b'Thursday, 19 Nov 2015, 11:24 am\r'
    unit:       millimeters
    step_size:  0.02
path_dat: orientation_test.datdata.misod_mg as 4 layers one for each neighboor.
data.misod_mg[:,:,0]for the top onedata.misod_mg[:,:,1]for the left onedata.misod_mg[:,:,2]for the right onedata.misod_mg[:,:,3]for the bottom one
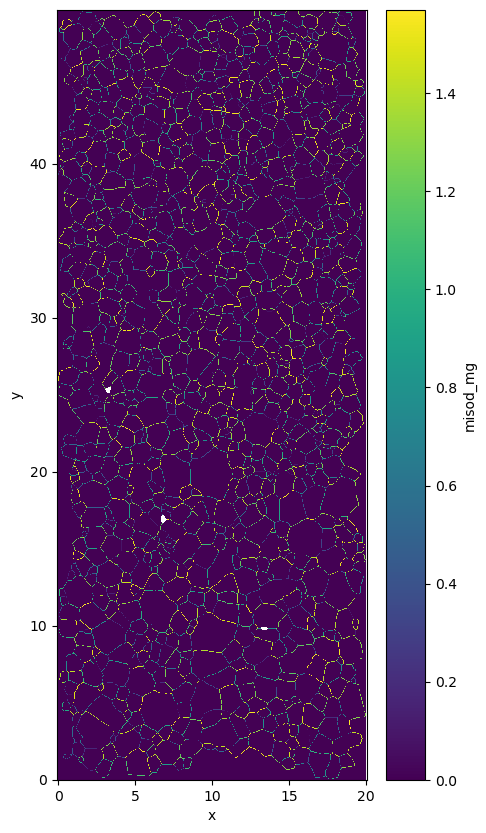
You can plot the maxium for each pixel if you want to.
plt.figure(figsize=(5,10))
data.misod_mg.max(axis=2).plot.imshow()
plt.axis('equal')
(-0.01, 19.990000000000002, -0.010000000000001563, 49.99000000000001)
Random misorientation distribution#
It is important to compare the distribution with the random distribution. A strong texture can already have a strong impact on the random distribution therefore you should always compare your distribtion with the random one.
random_misod=data.orientation_mg.uvecs.mis_angle(random=True)
---------------------------------------------------------------------------
AttributeError                            Traceback (most recent call last)
Cell In[10], line 1
----> 1 random_misod=data.orientation_mg.uvecs.mis_angle(random=True)

File /opt/conda/envs/basepy39-AITA/lib/python3.11/site-packages/xarrayuvecs/uvecs.py:229, in uvecs.mis_angle(self, random)
    227 phi1 = phi1[~np.isnan(phi1)]
    228 phi = phi[~np.isnan(phi)]
--> 229 dd=np.int(np.sqrt(len(phi1)))
    230 phi1=phi1[0:dd**2].reshape([dd,dd])
    231 phi=phi[0:dd**2].reshape([dd,dd])

File /opt/conda/envs/basepy39-AITA/lib/python3.11/site-packages/numpy/__init__.py:324, in __getattr__(attr)
    319     warnings.warn(
    320         f"In the future `np.{attr}` will be defined as the "
    321         "corresponding NumPy scalar.", FutureWarning, stacklevel=2)
    323 if attr in __former_attrs__:
--> 324     raise AttributeError(__former_attrs__[attr])
    326 if attr == 'testing':
    327     import numpy.testing as testing

AttributeError: module 'numpy' has no attribute 'int'.
`np.int` was a deprecated alias for the builtin `int`. To avoid this error in existing code, use `int` by itself. Doing this will not modify any behavior and is safe. When replacing `np.int`, you may wish to use e.g. `np.int64` or `np.int32` to specify the precision. If you wish to review your current use, check the release note link for additional information.
The aliases was originally deprecated in NumPy 1.20; for more details and guidance see the original release note at:
    https://numpy.org/devdocs/release/1.20.0-notes.html#deprecations
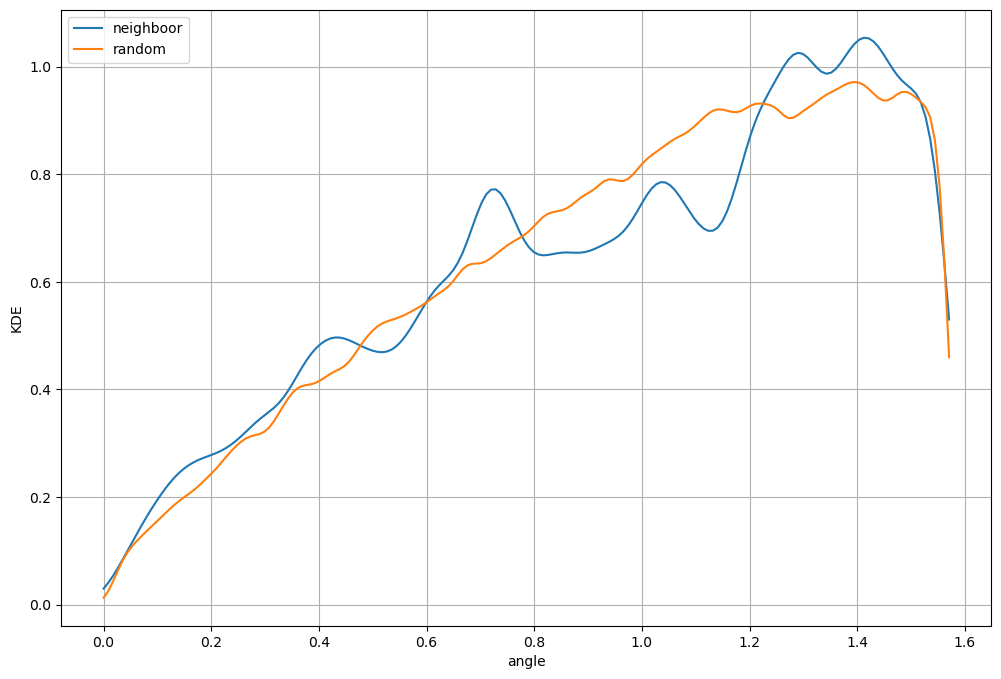
Plot misorientation profile#
You can filter the small angle value if you want
lim = 1 #degre
Calcul KDE for neighboor results.
angle=np.array(data.misod_mg).flatten()
angle = angle[~np.isnan(angle)]
angle = angle[np.where(angle>lim*np.pi/180)]

kernel_a = scipy.stats.gaussian_kde(angle)
xeval_a=np.linspace(0,np.pi/2,180)
yeval_a=kernel_a(xeval_a)
Calcul KDE for random results.
rangle=random_misod[random_misod>lim*np.pi/180]
kernel_ra = scipy.stats.gaussian_kde(rangle)
xeval_ra=np.linspace(0,np.pi/2,180)
yeval_ra=kernel_ra(xeval_ra)
Plot both distribution
plt.figure(figsize=(12,8))
plt.plot(xeval_a,yeval_a,label='neighboor')
plt.plot(xeval_ra,yeval_ra,label='random')
plt.legend()
plt.grid()
plt.xlabel('angle')
plt.ylabel('KDE')
Text(0, 0.5, 'KDE')