Quick start
Warning
It is currently under devellopement. Please contact me before using it.
Load CraFT output
import xarrayaita.aita as xa
import xarrayuvecs.uvecs as xu
import xarray_craft.loadData_craft as ldc
import xarray_symTensor2d.xarray_symTensor2d as xsT
import xarray_craft.gamma as xg
import xarray_craft.craft as xc

import numpy as np
import matplotlib.pyplot as plt
%matplotlib inline
adr='/home/chauvet/Documents/GitToolboxs/pyCraFT/Exemple/data/'
time='09.20000000e+04'
ds=ldc.craft1time_2d(adr,time)
ds
<xarray.Dataset>
Dimensions:      (g: 12, sT: 6, time: 1, uvecs: 2, x: 495, y: 539)
Coordinates:
  * x            (x) float64 0.0 0.15 0.3 0.45 0.6 ... 73.65 73.8 73.95 74.1
  * y            (y) float64 0.0 0.15 0.3 0.45 0.6 ... 80.25 80.4 80.55 80.7
Dimensions without coordinates: g, sT, time, uvecs
Data variables:
    orientation  (y, x, uvecs) float64 5.112 1.017 5.112 ... 1.14 3.454 1.14
    quality      (y, x) float64 100.0 100.0 100.0 100.0 ... 100.0 100.0 100.0
    micro        (y, x) bool True True True True True ... True True True True
    grainId      (y, x) float32 74.0 74.0 74.0 74.0 74.0 ... 11.0 11.0 11.0 11.0
    strain       (time, y, x, sT) float64 0.003301 -0.005215 ... 0.0006602
    stress       (time, y, x, sT) float64 1.274 0.5916 0.6825 ... -0.1443 0.2065
    gamma        (time, y, x, g) float64 0.004711 -0.007798 ... -5.391e-08
Attributes:
    unit:       millimeters
    step_size:  0.15
    path_dat:   /home/chauvet/Documents/GitToolboxs/pyCraFT/Exemple/data/CI02...
    simu_time:  09.20000000e+04
xarray.Dataset
- g: 12
- sT: 6
- time: 1
- uvecs: 2
- x: 495
- y: 539
- x(x)float640.0 0.15 0.3 ... 73.8 73.95 74.1
array([ 0. , 0.15, 0.3 , ..., 73.8 , 73.95, 74.1 ])
- y(y)float640.0 0.15 0.3 ... 80.4 80.55 80.7
array([ 0. , 0.15, 0.3 , ..., 80.4 , 80.55, 80.7 ])
- orientation(y, x, uvecs)float645.112 1.017 5.112 ... 3.454 1.14
array([[[5.11152761, 1.01688898], [5.11152761, 1.01688898], [5.11152761, 1.01688898], ..., [0.07863741, 1.39732552], [0.07863741, 1.39732552], [0.07863741, 1.39732552]], [[5.11152761, 1.01688898], [5.11152761, 1.01688898], [5.11152761, 1.01688898], ..., [0.07863741, 1.39732552], [0.07863741, 1.39732552], [0.07863741, 1.39732552]], [[5.11152761, 1.01688898], [5.11152761, 1.01688898], [5.11152761, 1.01688898], ..., ... ..., [3.45393626, 1.1396507 ], [3.45393626, 1.1396507 ], [3.45393626, 1.1396507 ]], [[6.19534503, 1.50385344], [6.19534503, 1.50385344], [6.19534503, 1.50385344], ..., [3.45393626, 1.1396507 ], [3.45393626, 1.1396507 ], [3.45393626, 1.1396507 ]], [[6.19534503, 1.50385344], [6.19534503, 1.50385344], [6.19534503, 1.50385344], ..., [3.45393626, 1.1396507 ], [3.45393626, 1.1396507 ], [3.45393626, 1.1396507 ]]]) - quality(y, x)float64100.0 100.0 100.0 ... 100.0 100.0
array([[100., 100., 100., ..., 100., 100., 100.], [100., 100., 100., ..., 100., 100., 100.], [100., 100., 100., ..., 100., 100., 100.], ..., [100., 100., 100., ..., 100., 100., 100.], [100., 100., 100., ..., 100., 100., 100.], [100., 100., 100., ..., 100., 100., 100.]]) - micro(y, x)boolTrue True True ... True True True
array([[ True, True, True, ..., True, True, True], [ True, False, False, ..., False, False, True], [ True, False, False, ..., False, False, True], ..., [ True, False, False, ..., False, False, True], [ True, False, False, ..., False, False, True], [ True, True, True, ..., True, True, True]]) - grainId(y, x)float3274.0 74.0 74.0 ... 11.0 11.0 11.0
array([[74., 74., 74., ..., 66., 66., 66.], [74., 74., 74., ..., 66., 66., 66.], [74., 74., 74., ..., 66., 66., 66.], ..., [ 1., 1., 1., ..., 11., 11., 11.], [ 1., 1., 1., ..., 11., 11., 11.], [ 1., 1., 1., ..., 11., 11., 11.]], dtype=float32) - strain(time, y, x, sT)float640.003301 -0.005215 ... 0.0006602
array([[[[ 3.30084836e-03, -5.21497794e-03, 2.00915060e-03, -6.90976054e-04, 3.36047104e-03, -8.63109062e-04], [-2.67275848e-03, 7.55549519e-04, 2.00915060e-03, 6.39981382e-03, -3.78430457e-04, -3.25864164e-03], [-4.09413973e-03, 2.18997821e-03, 2.00915060e-03, 8.55498475e-03, -1.92334943e-03, -4.47963899e-03], ..., [ 2.04830244e-03, -4.01808284e-03, 2.00915060e-03, -8.61082065e-03, -1.47710215e-03, -2.71257920e-03], [ 1.32006189e-03, -3.28571553e-03, 2.00915060e-03, -7.80890599e-03, 2.26761503e-04, -2.42896774e-03], [ 1.68175572e-03, -3.63542343e-03, 2.00915060e-03, -9.45160630e-03, -9.02446916e-06, -1.25099961e-03]], [[ 1.05556766e-04, -2.08322082e-03, 2.00915060e-03, 1.42516771e-03, 1.30849058e-03, -1.19785572e-03], [-5.97441091e-03, 4.04540982e-03, 2.00915060e-03, 8.72056401e-03, -2.65234516e-03, -3.73461696e-03], [-4.29613534e-03, 2.38999465e-03, 2.00915060e-03, 8.39610750e-03, -1.59838430e-03, -4.16123590e-03], ... [-4.10781651e-05, -2.00086762e-03, 2.00915060e-03, -8.98397751e-04, -3.86306915e-04, 5.73585236e-05], [-7.49257560e-05, -1.97132477e-03, 2.00915060e-03, -1.02686375e-03, -4.49655773e-04, -1.10045977e-04], [-4.37114678e-04, -1.59707290e-03, 2.00915060e-03, -1.07843979e-03, -9.44229757e-04, 2.82451361e-04]], [[ 7.88458277e-04, -2.73343871e-03, 2.00915060e-03, 7.86310050e-03, 3.20951604e-03, 5.49763476e-04], [ 2.15020332e-03, -4.10948896e-03, 2.00915060e-03, 1.51449375e-02, 1.32289584e-03, 1.42429125e-03], [ 2.65218168e-03, -4.59577380e-03, 2.00915060e-03, 1.91139568e-02, -1.08449272e-03, -2.47671855e-04], ..., [ 1.00484308e-03, -3.04182913e-03, 2.00915060e-03, -2.98306039e-03, -1.06596902e-03, 6.64901492e-04], [ 7.54707483e-04, -2.78711720e-03, 2.00915060e-03, -2.12317218e-03, -4.99372093e-04, 6.00893410e-05], [ 4.73760610e-04, -2.50450105e-03, 2.00915060e-03, -1.25516416e-03, -3.61028850e-04, 6.60160776e-04]]]]) - stress(time, y, x, sT)float641.274 0.5916 ... -0.1443 0.2065
array([[[[ 1.27391424e+00, 5.91582844e-01, 6.82503812e-01, 3.67239772e-01, -5.23399066e-02, 2.35760329e-01], [ 1.12300043e+00, 6.87118435e-01, 6.54092312e-01, 4.30519544e-01, 1.14168074e-01, 2.66354646e-01], [ 1.09248109e+00, 1.02565974e+00, 6.83843355e-01, 2.42207292e-01, 2.68891934e-01, -9.02228853e-02], ..., [ 9.48281733e-01, -4.24833138e-01, 5.12048443e-01, 1.06406925e-01, 8.38243748e-02, -7.56383842e-02], [ 1.03224902e+00, -3.66472687e-01, 4.78636629e-01, 1.03367507e-01, 1.04939224e-01, -4.32904132e-02], [ 1.23369081e+00, -2.90135982e-01, 5.18511279e-01, 5.90590538e-02, 1.07686233e-01, 2.65299121e-01]], [[ 2.56843397e-01, 2.76275113e-01, 3.10457952e-01, 1.33254584e-01, 1.03459366e-01, 1.65912016e-01], [ 7.12285056e-01, 8.37180064e-01, 5.90217575e-01, 2.30377898e-01, 3.06901010e-01, 5.39055767e-02], [ 9.45891082e-01, 1.12247049e+00, 6.76717604e-01, 1.73366346e-01, 3.75693466e-01, -1.72769888e-01], ... [-2.83809611e-01, -3.86125668e-01, -2.06613331e-01, 8.86183834e-02, -2.72711856e-02, 1.07164519e-01], [-2.87796022e-01, -4.43337557e-01, -2.60876517e-01, 6.08406117e-02, -1.97619195e-02, 2.85911898e-02], [-2.53041777e-01, -2.08028591e-01, -2.07717872e-01, 7.50012805e-02, -7.08125703e-02, 1.69510433e-01]], [[-2.74836303e-01, 7.03417572e-01, 1.30637236e+00, 8.43572219e-02, -8.09268282e-02, 2.47109497e-01], [-5.78292663e-01, 6.69067865e-01, 1.26683083e+00, 1.04464207e-01, -9.39133183e-02, 3.71499803e-01], [-7.87623909e-01, 9.44437922e-01, 1.62888586e+00, 1.82520089e-01, -1.78310009e-01, -1.29920691e-01], ..., [-6.50660931e-03, -3.88031927e-01, -3.57308755e-01, 1.64082530e-01, -2.63091984e-01, -3.18325952e-04], [-5.88187237e-02, -3.99413392e-01, -1.68003098e-01, 1.40242878e-01, -1.16860116e-01, 2.18390565e-02], [-1.58240622e-01, -2.42557324e-01, -1.78600344e-01, 1.59487199e-01, -1.44328454e-01, 2.06512776e-01]]]]) - gamma(time, y, x, g)float640.004711 -0.007798 ... -5.391e-08
array([[[[ 4.71127949e-03, -7.79818792e-03,  1.12802236e-03, ...,
           1.05614090e-06,  7.26570288e-06,  6.17063956e-06],
         [-9.14054279e-03, -8.06488995e-04,  7.08087556e-03, ...,
          -6.82174869e-07,  5.51700760e-06,  5.75853659e-06],
         [-1.39332530e-02,  6.33798840e-04,  8.76597746e-03, ...,
          -6.45947340e-06, -1.27640155e-07, -1.15896171e-07],
         ...,
         [ 1.25946108e-02, -8.83689909e-03, -8.85128961e-04, ...,
          -1.80069350e-06, -1.54749200e-05, -1.79217577e-05],
         [ 1.25144628e-02, -5.74002104e-03, -2.13855611e-03, ...,
          -2.34671082e-06, -1.77940739e-05, -1.99206194e-05],
         [ 1.44141039e-02, -7.13826510e-03, -2.43263925e-03, ...,
          -1.01197296e-05, -8.09885670e-06, -9.33887132e-06]],

        [[-1.35719695e-04, -3.17976727e-03,  3.41949646e-03, ...,
          -2.95969923e-07,  1.83819429e-07,  1.45182076e-07],
         [-1.58516181e-02,  2.63656791e-03,  8.18171612e-03, ...,
          -2.25674068e-06,  4.79057428e-08,  6.60568693e-08],
         [-1.34880963e-02,  8.33169222e-04,  8.58846418e-03, ...,
          -2.09154487e-05, -5.95177083e-07, -5.16399099e-07],
...
         [-7.84610451e-04, -8.63045127e-04,  2.75062463e-03, ...,
          -9.48231496e-07, -1.70668497e-07, -1.53657323e-07],
         [-6.82222364e-04, -9.13621086e-04,  2.96181912e-03, ...,
          -6.07764078e-07, -7.62388923e-08, -7.39086998e-08],
         [-5.39541470e-04, -1.24663820e-03,  3.44626575e-03, ...,
          -2.30396599e-07, -2.32648594e-08, -3.07944351e-08]],

        [[ 2.91029217e-03,  5.27191825e-03, -1.32435524e-02, ...,
           4.17489892e-05,  8.61372976e-06,  9.50086557e-06],
         [ 1.25773562e-03,  1.58465479e-02, -1.99316063e-02, ...,
           1.10278263e-04,  2.58178331e-05,  2.96509301e-05],
         [-1.56335942e-04,  2.32112492e-02, -2.15701645e-02, ...,
           1.24062367e-04,  2.59933322e-04,  2.82440305e-04],
         ...,
         [-3.53835703e-03, -4.41187994e-04,  5.65586558e-03, ...,
          -1.64111288e-06, -1.23286158e-06, -1.30684652e-06],
         [-2.36326455e-03, -4.42733821e-04,  4.21673016e-03, ...,
          -5.27849689e-07, -5.61734832e-08, -5.90491986e-08],
         [-2.00419987e-03, -4.86163870e-04,  3.12706127e-03, ...,
          -3.83168358e-07, -5.63932685e-08, -5.39111065e-08]]]])
- unit :
- millimeters
- step_size :
- 0.15
- path_dat :
- /home/chauvet/Documents/GitToolboxs/pyCraFT/Exemple/data/CI02_539x495_micro.vtk
- simu_time :
- 09.20000000e+04
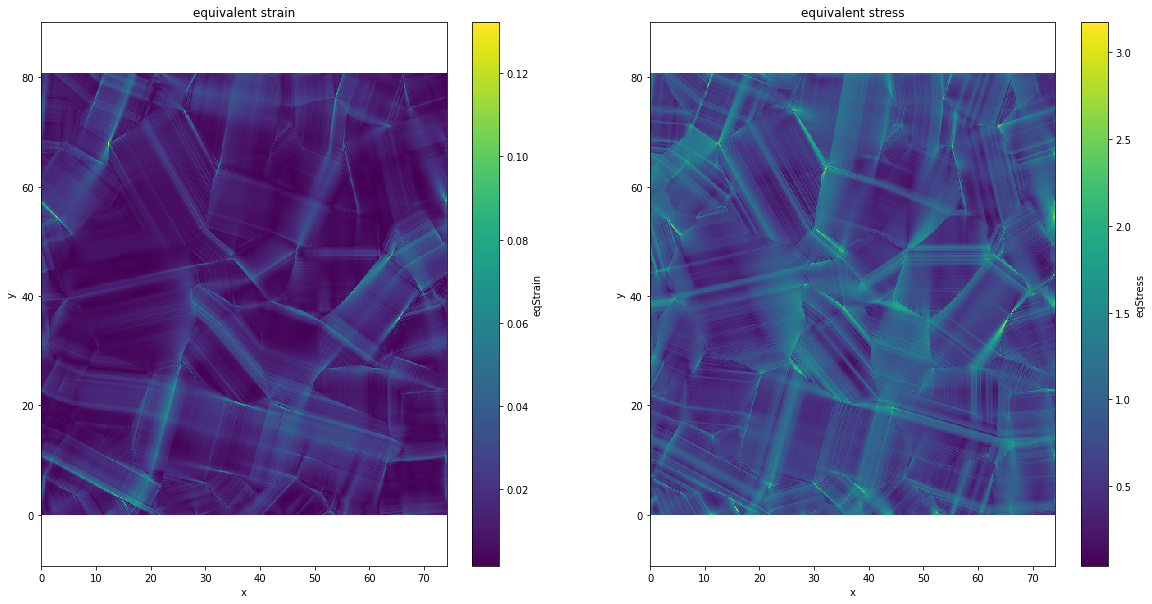
ds['eqStrain']=ds.strain.sT.eqVonMises()
ds['eqStress']=ds.stress.sT.eqVonMises()
plt.figure(figsize=(20,10))
plt.subplot(121)
ds.eqStrain.plot()
plt.axis('equal')
plt.title('equivalent strain')
plt.subplot(122)
ds.eqStress.plot()
plt.axis('equal')
plt.title('equivalent stress')
Text(0.5, 1.0, 'equivalent stress')
ds
<xarray.Dataset>
Dimensions:      (g: 12, sT: 6, time: 1, uvecs: 2, x: 495, y: 539)
Coordinates:
  * x            (x) float64 0.0 0.15 0.3 0.45 0.6 ... 73.65 73.8 73.95 74.1
  * y            (y) float64 0.0 0.15 0.3 0.45 0.6 ... 80.25 80.4 80.55 80.7
Dimensions without coordinates: g, sT, time, uvecs
Data variables:
    orientation  (y, x, uvecs) float64 5.112 1.017 5.112 ... 1.14 3.454 1.14
    quality      (y, x) float64 100.0 100.0 100.0 100.0 ... 100.0 100.0 100.0
    micro        (y, x) bool True True True True True ... True True True True
    grainId      (y, x) float32 74.0 74.0 74.0 74.0 74.0 ... 11.0 11.0 11.0 11.0
    strain       (time, y, x, sT) float64 0.003301 -0.005215 ... 0.0006602
    stress       (time, y, x, sT) float64 1.274 0.5916 0.6825 ... -0.1443 0.2065
    gamma        (time, y, x, g) float64 0.004711 -0.007798 ... -5.391e-08
    eqStrain     (time, y, x) float64 0.005463 0.007155 ... 0.00312 0.002566
    eqStress     (time, y, x) float64 1.121 1.095 1.153 ... 0.4573 0.3392 0.3612
Attributes:
    unit:       millimeters
    step_size:  0.15
    path_dat:   /home/chauvet/Documents/GitToolboxs/pyCraFT/Exemple/data/CI02...
    simu_time:  09.20000000e+04
xarray.Dataset
- g: 12
- sT: 6
- time: 1
- uvecs: 2
- x: 495
- y: 539
- x(x)float640.0 0.15 0.3 ... 73.8 73.95 74.1
array([ 0. , 0.15, 0.3 , ..., 73.8 , 73.95, 74.1 ])
- y(y)float640.0 0.15 0.3 ... 80.4 80.55 80.7
array([ 0. , 0.15, 0.3 , ..., 80.4 , 80.55, 80.7 ])
- orientation(y, x, uvecs)float645.112 1.017 5.112 ... 3.454 1.14
array([[[5.11152761, 1.01688898], [5.11152761, 1.01688898], [5.11152761, 1.01688898], ..., [0.07863741, 1.39732552], [0.07863741, 1.39732552], [0.07863741, 1.39732552]], [[5.11152761, 1.01688898], [5.11152761, 1.01688898], [5.11152761, 1.01688898], ..., [0.07863741, 1.39732552], [0.07863741, 1.39732552], [0.07863741, 1.39732552]], [[5.11152761, 1.01688898], [5.11152761, 1.01688898], [5.11152761, 1.01688898], ..., ... ..., [3.45393626, 1.1396507 ], [3.45393626, 1.1396507 ], [3.45393626, 1.1396507 ]], [[6.19534503, 1.50385344], [6.19534503, 1.50385344], [6.19534503, 1.50385344], ..., [3.45393626, 1.1396507 ], [3.45393626, 1.1396507 ], [3.45393626, 1.1396507 ]], [[6.19534503, 1.50385344], [6.19534503, 1.50385344], [6.19534503, 1.50385344], ..., [3.45393626, 1.1396507 ], [3.45393626, 1.1396507 ], [3.45393626, 1.1396507 ]]]) - quality(y, x)float64100.0 100.0 100.0 ... 100.0 100.0
array([[100., 100., 100., ..., 100., 100., 100.], [100., 100., 100., ..., 100., 100., 100.], [100., 100., 100., ..., 100., 100., 100.], ..., [100., 100., 100., ..., 100., 100., 100.], [100., 100., 100., ..., 100., 100., 100.], [100., 100., 100., ..., 100., 100., 100.]]) - micro(y, x)boolTrue True True ... True True True
array([[ True, True, True, ..., True, True, True], [ True, False, False, ..., False, False, True], [ True, False, False, ..., False, False, True], ..., [ True, False, False, ..., False, False, True], [ True, False, False, ..., False, False, True], [ True, True, True, ..., True, True, True]]) - grainId(y, x)float3274.0 74.0 74.0 ... 11.0 11.0 11.0
array([[74., 74., 74., ..., 66., 66., 66.], [74., 74., 74., ..., 66., 66., 66.], [74., 74., 74., ..., 66., 66., 66.], ..., [ 1., 1., 1., ..., 11., 11., 11.], [ 1., 1., 1., ..., 11., 11., 11.], [ 1., 1., 1., ..., 11., 11., 11.]], dtype=float32) - strain(time, y, x, sT)float640.003301 -0.005215 ... 0.0006602
array([[[[ 3.30084836e-03, -5.21497794e-03, 2.00915060e-03, -6.90976054e-04, 3.36047104e-03, -8.63109062e-04], [-2.67275848e-03, 7.55549519e-04, 2.00915060e-03, 6.39981382e-03, -3.78430457e-04, -3.25864164e-03], [-4.09413973e-03, 2.18997821e-03, 2.00915060e-03, 8.55498475e-03, -1.92334943e-03, -4.47963899e-03], ..., [ 2.04830244e-03, -4.01808284e-03, 2.00915060e-03, -8.61082065e-03, -1.47710215e-03, -2.71257920e-03], [ 1.32006189e-03, -3.28571553e-03, 2.00915060e-03, -7.80890599e-03, 2.26761503e-04, -2.42896774e-03], [ 1.68175572e-03, -3.63542343e-03, 2.00915060e-03, -9.45160630e-03, -9.02446916e-06, -1.25099961e-03]], [[ 1.05556766e-04, -2.08322082e-03, 2.00915060e-03, 1.42516771e-03, 1.30849058e-03, -1.19785572e-03], [-5.97441091e-03, 4.04540982e-03, 2.00915060e-03, 8.72056401e-03, -2.65234516e-03, -3.73461696e-03], [-4.29613534e-03, 2.38999465e-03, 2.00915060e-03, 8.39610750e-03, -1.59838430e-03, -4.16123590e-03], ... [-4.10781651e-05, -2.00086762e-03, 2.00915060e-03, -8.98397751e-04, -3.86306915e-04, 5.73585236e-05], [-7.49257560e-05, -1.97132477e-03, 2.00915060e-03, -1.02686375e-03, -4.49655773e-04, -1.10045977e-04], [-4.37114678e-04, -1.59707290e-03, 2.00915060e-03, -1.07843979e-03, -9.44229757e-04, 2.82451361e-04]], [[ 7.88458277e-04, -2.73343871e-03, 2.00915060e-03, 7.86310050e-03, 3.20951604e-03, 5.49763476e-04], [ 2.15020332e-03, -4.10948896e-03, 2.00915060e-03, 1.51449375e-02, 1.32289584e-03, 1.42429125e-03], [ 2.65218168e-03, -4.59577380e-03, 2.00915060e-03, 1.91139568e-02, -1.08449272e-03, -2.47671855e-04], ..., [ 1.00484308e-03, -3.04182913e-03, 2.00915060e-03, -2.98306039e-03, -1.06596902e-03, 6.64901492e-04], [ 7.54707483e-04, -2.78711720e-03, 2.00915060e-03, -2.12317218e-03, -4.99372093e-04, 6.00893410e-05], [ 4.73760610e-04, -2.50450105e-03, 2.00915060e-03, -1.25516416e-03, -3.61028850e-04, 6.60160776e-04]]]]) - stress(time, y, x, sT)float641.274 0.5916 ... -0.1443 0.2065
array([[[[ 1.27391424e+00, 5.91582844e-01, 6.82503812e-01, 3.67239772e-01, -5.23399066e-02, 2.35760329e-01], [ 1.12300043e+00, 6.87118435e-01, 6.54092312e-01, 4.30519544e-01, 1.14168074e-01, 2.66354646e-01], [ 1.09248109e+00, 1.02565974e+00, 6.83843355e-01, 2.42207292e-01, 2.68891934e-01, -9.02228853e-02], ..., [ 9.48281733e-01, -4.24833138e-01, 5.12048443e-01, 1.06406925e-01, 8.38243748e-02, -7.56383842e-02], [ 1.03224902e+00, -3.66472687e-01, 4.78636629e-01, 1.03367507e-01, 1.04939224e-01, -4.32904132e-02], [ 1.23369081e+00, -2.90135982e-01, 5.18511279e-01, 5.90590538e-02, 1.07686233e-01, 2.65299121e-01]], [[ 2.56843397e-01, 2.76275113e-01, 3.10457952e-01, 1.33254584e-01, 1.03459366e-01, 1.65912016e-01], [ 7.12285056e-01, 8.37180064e-01, 5.90217575e-01, 2.30377898e-01, 3.06901010e-01, 5.39055767e-02], [ 9.45891082e-01, 1.12247049e+00, 6.76717604e-01, 1.73366346e-01, 3.75693466e-01, -1.72769888e-01], ... [-2.83809611e-01, -3.86125668e-01, -2.06613331e-01, 8.86183834e-02, -2.72711856e-02, 1.07164519e-01], [-2.87796022e-01, -4.43337557e-01, -2.60876517e-01, 6.08406117e-02, -1.97619195e-02, 2.85911898e-02], [-2.53041777e-01, -2.08028591e-01, -2.07717872e-01, 7.50012805e-02, -7.08125703e-02, 1.69510433e-01]], [[-2.74836303e-01, 7.03417572e-01, 1.30637236e+00, 8.43572219e-02, -8.09268282e-02, 2.47109497e-01], [-5.78292663e-01, 6.69067865e-01, 1.26683083e+00, 1.04464207e-01, -9.39133183e-02, 3.71499803e-01], [-7.87623909e-01, 9.44437922e-01, 1.62888586e+00, 1.82520089e-01, -1.78310009e-01, -1.29920691e-01], ..., [-6.50660931e-03, -3.88031927e-01, -3.57308755e-01, 1.64082530e-01, -2.63091984e-01, -3.18325952e-04], [-5.88187237e-02, -3.99413392e-01, -1.68003098e-01, 1.40242878e-01, -1.16860116e-01, 2.18390565e-02], [-1.58240622e-01, -2.42557324e-01, -1.78600344e-01, 1.59487199e-01, -1.44328454e-01, 2.06512776e-01]]]]) - gamma(time, y, x, g)float640.004711 -0.007798 ... -5.391e-08
array([[[[ 4.71127949e-03, -7.79818792e-03, 1.12802236e-03, ..., 1.05614090e-06, 7.26570288e-06, 6.17063956e-06], [-9.14054279e-03, -8.06488995e-04, 7.08087556e-03, ..., -6.82174869e-07, 5.51700760e-06, 5.75853659e-06], [-1.39332530e-02, 6.33798840e-04, 8.76597746e-03, ..., -6.45947340e-06, -1.27640155e-07, -1.15896171e-07], ..., [ 1.25946108e-02, -8.83689909e-03, -8.85128961e-04, ..., -1.80069350e-06, -1.54749200e-05, -1.79217577e-05], [ 1.25144628e-02, -5.74002104e-03, -2.13855611e-03, ..., -2.34671082e-06, -1.77940739e-05, -1.99206194e-05], [ 1.44141039e-02, -7.13826510e-03, -2.43263925e-03, ..., -1.01197296e-05, -8.09885670e-06, -9.33887132e-06]], [[-1.35719695e-04, -3.17976727e-03, 3.41949646e-03, ..., -2.95969923e-07, 1.83819429e-07, 1.45182076e-07], [-1.58516181e-02, 2.63656791e-03, 8.18171612e-03, ..., -2.25674068e-06, 4.79057428e-08, 6.60568693e-08], [-1.34880963e-02, 8.33169222e-04, 8.58846418e-03, ..., -2.09154487e-05, -5.95177083e-07, -5.16399099e-07], ... [-7.84610451e-04, -8.63045127e-04, 2.75062463e-03, ..., -9.48231496e-07, -1.70668497e-07, -1.53657323e-07], [-6.82222364e-04, -9.13621086e-04, 2.96181912e-03, ..., -6.07764078e-07, -7.62388923e-08, -7.39086998e-08], [-5.39541470e-04, -1.24663820e-03, 3.44626575e-03, ..., -2.30396599e-07, -2.32648594e-08, -3.07944351e-08]], [[ 2.91029217e-03, 5.27191825e-03, -1.32435524e-02, ..., 4.17489892e-05, 8.61372976e-06, 9.50086557e-06], [ 1.25773562e-03, 1.58465479e-02, -1.99316063e-02, ..., 1.10278263e-04, 2.58178331e-05, 2.96509301e-05], [-1.56335942e-04, 2.32112492e-02, -2.15701645e-02, ..., 1.24062367e-04, 2.59933322e-04, 2.82440305e-04], ..., [-3.53835703e-03, -4.41187994e-04, 5.65586558e-03, ..., -1.64111288e-06, -1.23286158e-06, -1.30684652e-06], [-2.36326455e-03, -4.42733821e-04, 4.21673016e-03, ..., -5.27849689e-07, -5.61734832e-08, -5.90491986e-08], [-2.00419987e-03, -4.86163870e-04, 3.12706127e-03, ..., -3.83168358e-07, -5.63932685e-08, -5.39111065e-08]]]]) - eqStrain(time, y, x)float640.005463 0.007155 ... 0.002566
array([[[0.00546336, 0.00715512, 0.00987709, ..., 0.00923158, 0.00817682, 0.00947223], [0.00288628, 0.01054423, 0.00963642, ..., 0.00891056, 0.0069643 , 0.00982094], [0.00300017, 0.01138601, 0.00772905, ..., 0.01223277, 0.00905229, 0.01422602], ..., [0.00757461, 0.01466688, 0.01844639, ..., 0.00243156, 0.0034808 , 0.00300171], [0.00727748, 0.01436258, 0.0200169 , ..., 0.00210408, 0.00215674, 0.00221582], [0.00835313, 0.01478503, 0.01844335, ..., 0.00395829, 0.00311954, 0.00256618]]]) - eqStress(time, y, x)float641.121 1.095 1.153 ... 0.3392 0.3612
array([[[1.12051855, 1.09539458, 1.15303453, ..., 0.78600404,
         0.80995901, 0.95358078],
        [0.39477445, 0.90845737, 1.1575258 , ..., 0.43886374,
         0.38614567, 0.44618879],
        [0.30747733, 0.70960697, 1.01249987, ..., 0.4401428 ,
         0.40668759, 0.39889091],
        ...,
        [0.98429013, 1.21307591, 1.32468799, ..., 0.44421997,
         0.4292111 , 0.32537437],
        [0.94645882, 1.16693715, 1.33302598, ..., 0.37267343,
         0.39846954, 0.31916526],
        [1.03845972, 1.09593668, 1.38717273, ..., 0.45731671,
         0.33916127, 0.36123309]]])
- unit :
- millimeters
- step_size :
- 0.15
- path_dat :
- /home/chauvet/Documents/GitToolboxs/pyCraFT/Exemple/data/CI02_539x495_micro.vtk
- simu_time :
- 09.20000000e+04
ds['strain_energy']=ds.craft.strain_energy()
plt.figure(figsize=(10,10))
ds.strain_energy.plot()
plt.axis('equal')
(-0.075, 74.17499999999998, -0.075, 80.775)

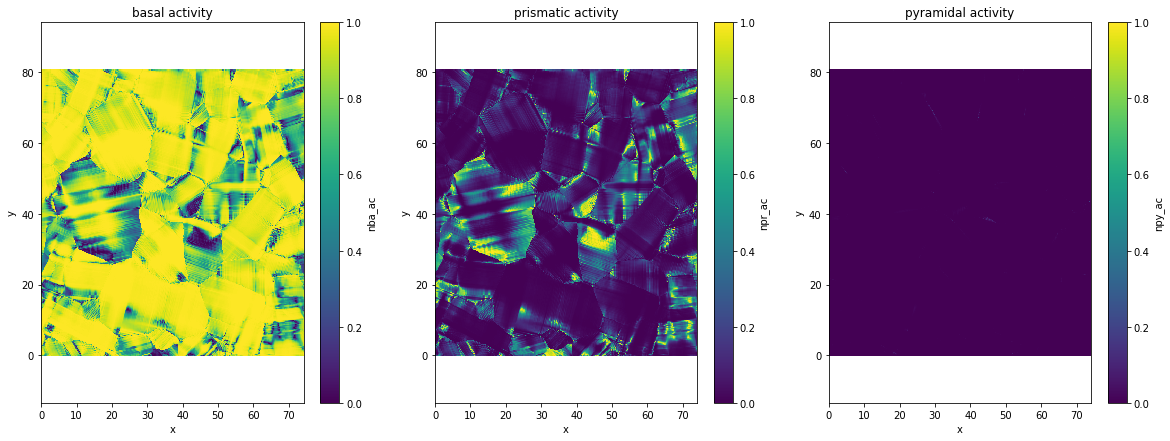
ds['nba_ac']=ds.gamma.gamma.gamma_activity(plane='ba')
ds['npr_ac']=ds.gamma.gamma.gamma_activity(plane='pr')
ds['npy_ac']=ds.gamma.gamma.gamma_activity(plane='py')
plt.figure(figsize=(20,7))
plt.subplot(131)
ds.nba_ac.plot(vmin=0,vmax=1)
plt.axis('equal')
plt.title('basal activity')
plt.subplot(132)
ds.npr_ac.plot(vmin=0,vmax=1)
plt.axis('equal')
plt.title('prismatic activity')
plt.subplot(133)
ds.npy_ac.plot(vmin=0,vmax=1)
plt.axis('equal')
plt.title('pyramidal activity')
Text(0.5, 1.0, 'pyramidal activity')
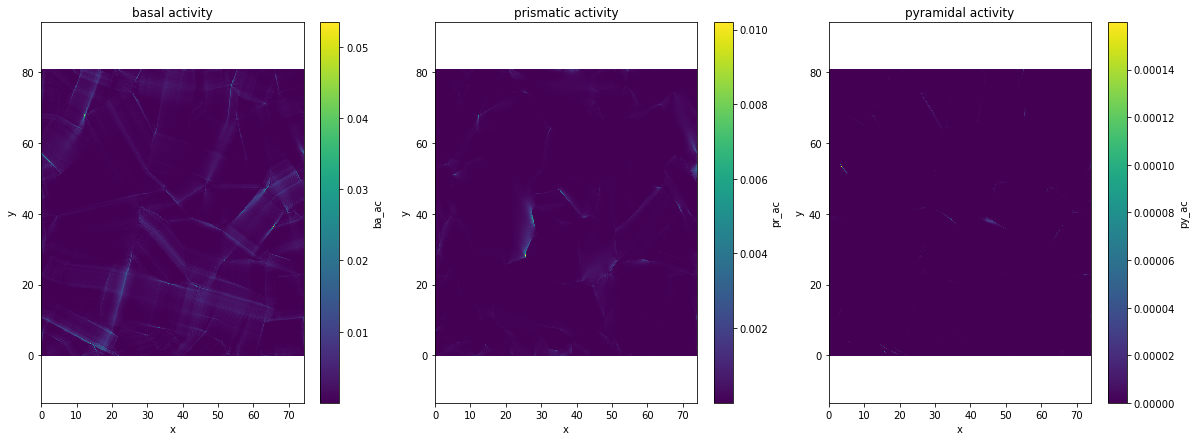
ds['ba_ac']=ds.gamma.gamma.gamma_activity(plane='ba',norm=False)
ds['pr_ac']=ds.gamma.gamma.gamma_activity(plane='pr',norm=False)
ds['py_ac']=ds.gamma.gamma.gamma_activity(plane='py',norm=False)
plt.figure(figsize=(20,7))
plt.subplot(131)
ds.ba_ac.plot()
plt.axis('equal')
plt.title('basal activity')
plt.subplot(132)
ds.pr_ac.plot()
plt.axis('equal')
plt.title('prismatic activity')
plt.subplot(133)
ds.py_ac.plot()
plt.axis('equal')
plt.title('pyramidal activity')
Text(0.5, 1.0, 'pyramidal activity')
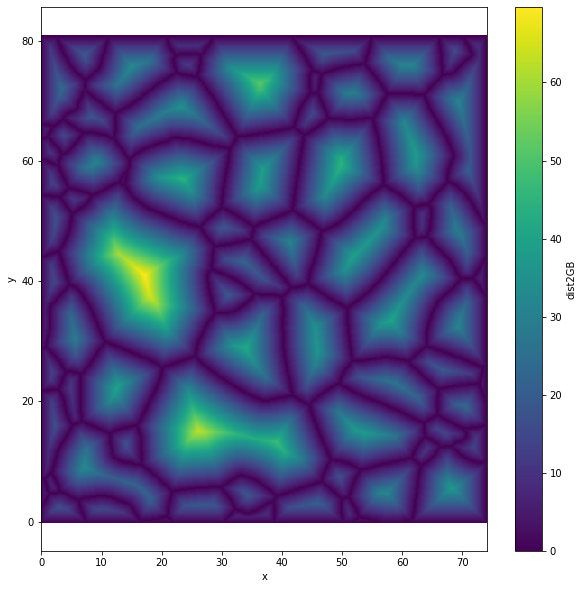
ds['dist2GB']=ds.aita.dist2GB()
plt.figure(figsize=(10,10))
ds.dist2GB.plot()
plt.axis('equal')
(-0.075, 74.17499999999998, -0.075, 80.775)
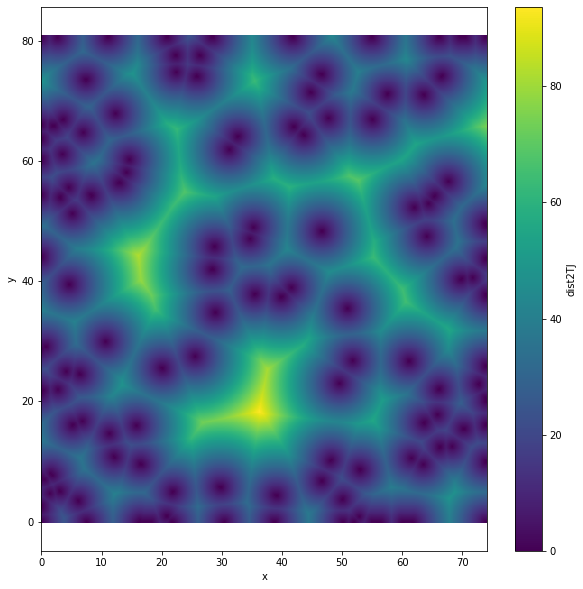
ds['dist2TJ']=ds.aita.dist2TJ()
plt.figure(figsize=(10,10))
ds.dist2TJ.plot()
plt.axis('equal')
(-0.075, 74.17499999999998, -0.075, 80.775)
ds
<xarray.Dataset>
Dimensions:        (g: 12, sT: 6, time: 1, uvecs: 2, x: 495, y: 539)
Coordinates:
  * x              (x) float64 0.0 0.15 0.3 0.45 0.6 ... 73.65 73.8 73.95 74.1
  * y              (y) float64 0.0 0.15 0.3 0.45 0.6 ... 80.25 80.4 80.55 80.7
Dimensions without coordinates: g, sT, time, uvecs
Data variables: (12/18)
    orientation    (y, x, uvecs) float64 5.112 1.017 5.112 ... 1.14 3.454 1.14
    quality        (y, x) float64 100.0 100.0 100.0 100.0 ... 100.0 100.0 100.0
    micro          (y, x) bool True True True True True ... True True True True
    grainId        (y, x) float32 74.0 74.0 74.0 74.0 ... 11.0 11.0 11.0 11.0
    strain         (time, y, x, sT) float64 0.003301 -0.005215 ... 0.0006602
    stress         (time, y, x, sT) float64 1.274 0.5916 ... -0.1443 0.2065
    ...             ...
    npy_ac         (time, y, x) float128 6.92e-06 1.029e-06 ... 4.254e-08
    ba_ac          (time, y, x) float128 8.428e-05 0.0001343 ... 1.403e-05
    pr_ac          (time, y, x) float128 5.951e-06 2.098e-05 ... 6.385e-06
    py_ac          (time, y, x) float128 6.244e-10 1.598e-10 ... 8.686e-13
    dist2GB        (y, x) float64 0.0 0.0 0.0 0.0 0.0 ... 0.0 0.0 0.0 0.0 0.0
    dist2TJ        (y, x) float64 1.0 0.0 1.0 2.0 3.0 ... 3.0 2.0 1.0 0.0 1.0
Attributes:
    unit:       millimeters
    step_size:  0.15
    path_dat:   /home/chauvet/Documents/GitToolboxs/pyCraFT/Exemple/data/CI02...
    simu_time:  09.20000000e+04
xarray.Dataset
- g: 12
- sT: 6
- time: 1
- uvecs: 2
- x: 495
- y: 539
- x(x)float640.0 0.15 0.3 ... 73.8 73.95 74.1
array([ 0. , 0.15, 0.3 , ..., 73.8 , 73.95, 74.1 ])
- y(y)float640.0 0.15 0.3 ... 80.4 80.55 80.7
array([ 0. , 0.15, 0.3 , ..., 80.4 , 80.55, 80.7 ])
- orientation(y, x, uvecs)float645.112 1.017 5.112 ... 3.454 1.14
array([[[5.11152761, 1.01688898], [5.11152761, 1.01688898], [5.11152761, 1.01688898], ..., [0.07863741, 1.39732552], [0.07863741, 1.39732552], [0.07863741, 1.39732552]], [[5.11152761, 1.01688898], [5.11152761, 1.01688898], [5.11152761, 1.01688898], ..., [0.07863741, 1.39732552], [0.07863741, 1.39732552], [0.07863741, 1.39732552]], [[5.11152761, 1.01688898], [5.11152761, 1.01688898], [5.11152761, 1.01688898], ..., ... ..., [3.45393626, 1.1396507 ], [3.45393626, 1.1396507 ], [3.45393626, 1.1396507 ]], [[6.19534503, 1.50385344], [6.19534503, 1.50385344], [6.19534503, 1.50385344], ..., [3.45393626, 1.1396507 ], [3.45393626, 1.1396507 ], [3.45393626, 1.1396507 ]], [[6.19534503, 1.50385344], [6.19534503, 1.50385344], [6.19534503, 1.50385344], ..., [3.45393626, 1.1396507 ], [3.45393626, 1.1396507 ], [3.45393626, 1.1396507 ]]]) - quality(y, x)float64100.0 100.0 100.0 ... 100.0 100.0
array([[100., 100., 100., ..., 100., 100., 100.], [100., 100., 100., ..., 100., 100., 100.], [100., 100., 100., ..., 100., 100., 100.], ..., [100., 100., 100., ..., 100., 100., 100.], [100., 100., 100., ..., 100., 100., 100.], [100., 100., 100., ..., 100., 100., 100.]]) - micro(y, x)boolTrue True True ... True True True
array([[ True, True, True, ..., True, True, True], [ True, False, False, ..., False, False, True], [ True, False, False, ..., False, False, True], ..., [ True, False, False, ..., False, False, True], [ True, False, False, ..., False, False, True], [ True, True, True, ..., True, True, True]]) - grainId(y, x)float3274.0 74.0 74.0 ... 11.0 11.0 11.0
array([[74., 74., 74., ..., 66., 66., 66.], [74., 74., 74., ..., 66., 66., 66.], [74., 74., 74., ..., 66., 66., 66.], ..., [ 1., 1., 1., ..., 11., 11., 11.], [ 1., 1., 1., ..., 11., 11., 11.], [ 1., 1., 1., ..., 11., 11., 11.]], dtype=float32) - strain(time, y, x, sT)float640.003301 -0.005215 ... 0.0006602
array([[[[ 3.30084836e-03, -5.21497794e-03, 2.00915060e-03, -6.90976054e-04, 3.36047104e-03, -8.63109062e-04], [-2.67275848e-03, 7.55549519e-04, 2.00915060e-03, 6.39981382e-03, -3.78430457e-04, -3.25864164e-03], [-4.09413973e-03, 2.18997821e-03, 2.00915060e-03, 8.55498475e-03, -1.92334943e-03, -4.47963899e-03], ..., [ 2.04830244e-03, -4.01808284e-03, 2.00915060e-03, -8.61082065e-03, -1.47710215e-03, -2.71257920e-03], [ 1.32006189e-03, -3.28571553e-03, 2.00915060e-03, -7.80890599e-03, 2.26761503e-04, -2.42896774e-03], [ 1.68175572e-03, -3.63542343e-03, 2.00915060e-03, -9.45160630e-03, -9.02446916e-06, -1.25099961e-03]], [[ 1.05556766e-04, -2.08322082e-03, 2.00915060e-03, 1.42516771e-03, 1.30849058e-03, -1.19785572e-03], [-5.97441091e-03, 4.04540982e-03, 2.00915060e-03, 8.72056401e-03, -2.65234516e-03, -3.73461696e-03], [-4.29613534e-03, 2.38999465e-03, 2.00915060e-03, 8.39610750e-03, -1.59838430e-03, -4.16123590e-03], ... [-4.10781651e-05, -2.00086762e-03, 2.00915060e-03, -8.98397751e-04, -3.86306915e-04, 5.73585236e-05], [-7.49257560e-05, -1.97132477e-03, 2.00915060e-03, -1.02686375e-03, -4.49655773e-04, -1.10045977e-04], [-4.37114678e-04, -1.59707290e-03, 2.00915060e-03, -1.07843979e-03, -9.44229757e-04, 2.82451361e-04]], [[ 7.88458277e-04, -2.73343871e-03, 2.00915060e-03, 7.86310050e-03, 3.20951604e-03, 5.49763476e-04], [ 2.15020332e-03, -4.10948896e-03, 2.00915060e-03, 1.51449375e-02, 1.32289584e-03, 1.42429125e-03], [ 2.65218168e-03, -4.59577380e-03, 2.00915060e-03, 1.91139568e-02, -1.08449272e-03, -2.47671855e-04], ..., [ 1.00484308e-03, -3.04182913e-03, 2.00915060e-03, -2.98306039e-03, -1.06596902e-03, 6.64901492e-04], [ 7.54707483e-04, -2.78711720e-03, 2.00915060e-03, -2.12317218e-03, -4.99372093e-04, 6.00893410e-05], [ 4.73760610e-04, -2.50450105e-03, 2.00915060e-03, -1.25516416e-03, -3.61028850e-04, 6.60160776e-04]]]]) - stress(time, y, x, sT)float641.274 0.5916 ... -0.1443 0.2065
array([[[[ 1.27391424e+00, 5.91582844e-01, 6.82503812e-01, 3.67239772e-01, -5.23399066e-02, 2.35760329e-01], [ 1.12300043e+00, 6.87118435e-01, 6.54092312e-01, 4.30519544e-01, 1.14168074e-01, 2.66354646e-01], [ 1.09248109e+00, 1.02565974e+00, 6.83843355e-01, 2.42207292e-01, 2.68891934e-01, -9.02228853e-02], ..., [ 9.48281733e-01, -4.24833138e-01, 5.12048443e-01, 1.06406925e-01, 8.38243748e-02, -7.56383842e-02], [ 1.03224902e+00, -3.66472687e-01, 4.78636629e-01, 1.03367507e-01, 1.04939224e-01, -4.32904132e-02], [ 1.23369081e+00, -2.90135982e-01, 5.18511279e-01, 5.90590538e-02, 1.07686233e-01, 2.65299121e-01]], [[ 2.56843397e-01, 2.76275113e-01, 3.10457952e-01, 1.33254584e-01, 1.03459366e-01, 1.65912016e-01], [ 7.12285056e-01, 8.37180064e-01, 5.90217575e-01, 2.30377898e-01, 3.06901010e-01, 5.39055767e-02], [ 9.45891082e-01, 1.12247049e+00, 6.76717604e-01, 1.73366346e-01, 3.75693466e-01, -1.72769888e-01], ... [-2.83809611e-01, -3.86125668e-01, -2.06613331e-01, 8.86183834e-02, -2.72711856e-02, 1.07164519e-01], [-2.87796022e-01, -4.43337557e-01, -2.60876517e-01, 6.08406117e-02, -1.97619195e-02, 2.85911898e-02], [-2.53041777e-01, -2.08028591e-01, -2.07717872e-01, 7.50012805e-02, -7.08125703e-02, 1.69510433e-01]], [[-2.74836303e-01, 7.03417572e-01, 1.30637236e+00, 8.43572219e-02, -8.09268282e-02, 2.47109497e-01], [-5.78292663e-01, 6.69067865e-01, 1.26683083e+00, 1.04464207e-01, -9.39133183e-02, 3.71499803e-01], [-7.87623909e-01, 9.44437922e-01, 1.62888586e+00, 1.82520089e-01, -1.78310009e-01, -1.29920691e-01], ..., [-6.50660931e-03, -3.88031927e-01, -3.57308755e-01, 1.64082530e-01, -2.63091984e-01, -3.18325952e-04], [-5.88187237e-02, -3.99413392e-01, -1.68003098e-01, 1.40242878e-01, -1.16860116e-01, 2.18390565e-02], [-1.58240622e-01, -2.42557324e-01, -1.78600344e-01, 1.59487199e-01, -1.44328454e-01, 2.06512776e-01]]]]) - gamma(time, y, x, g)float640.004711 -0.007798 ... -5.391e-08
array([[[[ 4.71127949e-03, -7.79818792e-03, 1.12802236e-03, ..., 1.05614090e-06, 7.26570288e-06, 6.17063956e-06], [-9.14054279e-03, -8.06488995e-04, 7.08087556e-03, ..., -6.82174869e-07, 5.51700760e-06, 5.75853659e-06], [-1.39332530e-02, 6.33798840e-04, 8.76597746e-03, ..., -6.45947340e-06, -1.27640155e-07, -1.15896171e-07], ..., [ 1.25946108e-02, -8.83689909e-03, -8.85128961e-04, ..., -1.80069350e-06, -1.54749200e-05, -1.79217577e-05], [ 1.25144628e-02, -5.74002104e-03, -2.13855611e-03, ..., -2.34671082e-06, -1.77940739e-05, -1.99206194e-05], [ 1.44141039e-02, -7.13826510e-03, -2.43263925e-03, ..., -1.01197296e-05, -8.09885670e-06, -9.33887132e-06]], [[-1.35719695e-04, -3.17976727e-03, 3.41949646e-03, ..., -2.95969923e-07, 1.83819429e-07, 1.45182076e-07], [-1.58516181e-02, 2.63656791e-03, 8.18171612e-03, ..., -2.25674068e-06, 4.79057428e-08, 6.60568693e-08], [-1.34880963e-02, 8.33169222e-04, 8.58846418e-03, ..., -2.09154487e-05, -5.95177083e-07, -5.16399099e-07], ... [-7.84610451e-04, -8.63045127e-04, 2.75062463e-03, ..., -9.48231496e-07, -1.70668497e-07, -1.53657323e-07], [-6.82222364e-04, -9.13621086e-04, 2.96181912e-03, ..., -6.07764078e-07, -7.62388923e-08, -7.39086998e-08], [-5.39541470e-04, -1.24663820e-03, 3.44626575e-03, ..., -2.30396599e-07, -2.32648594e-08, -3.07944351e-08]], [[ 2.91029217e-03, 5.27191825e-03, -1.32435524e-02, ..., 4.17489892e-05, 8.61372976e-06, 9.50086557e-06], [ 1.25773562e-03, 1.58465479e-02, -1.99316063e-02, ..., 1.10278263e-04, 2.58178331e-05, 2.96509301e-05], [-1.56335942e-04, 2.32112492e-02, -2.15701645e-02, ..., 1.24062367e-04, 2.59933322e-04, 2.82440305e-04], ..., [-3.53835703e-03, -4.41187994e-04, 5.65586558e-03, ..., -1.64111288e-06, -1.23286158e-06, -1.30684652e-06], [-2.36326455e-03, -4.42733821e-04, 4.21673016e-03, ..., -5.27849689e-07, -5.61734832e-08, -5.90491986e-08], [-2.00419987e-03, -4.86163870e-04, 3.12706127e-03, ..., -3.83168358e-07, -5.63932685e-08, -5.39111065e-08]]]]) - eqStrain(time, y, x)float640.005463 0.007155 ... 0.002566
array([[[0.00546336, 0.00715512, 0.00987709, ..., 0.00923158, 0.00817682, 0.00947223], [0.00288628, 0.01054423, 0.00963642, ..., 0.00891056, 0.0069643 , 0.00982094], [0.00300017, 0.01138601, 0.00772905, ..., 0.01223277, 0.00905229, 0.01422602], ..., [0.00757461, 0.01466688, 0.01844639, ..., 0.00243156, 0.0034808 , 0.00300171], [0.00727748, 0.01436258, 0.0200169 , ..., 0.00210408, 0.00215674, 0.00221582], [0.00835313, 0.01478503, 0.01844335, ..., 0.00395829, 0.00311954, 0.00256618]]]) - eqStress(time, y, x)float641.121 1.095 1.153 ... 0.3392 0.3612
array([[[1.12051855, 1.09539458, 1.15303453, ..., 0.78600404, 0.80995901, 0.95358078], [0.39477445, 0.90845737, 1.1575258 , ..., 0.43886374, 0.38614567, 0.44618879], [0.30747733, 0.70960697, 1.01249987, ..., 0.4401428 , 0.40668759, 0.39889091], ..., [0.98429013, 1.21307591, 1.32468799, ..., 0.44421997, 0.4292111 , 0.32537437], [0.94645882, 1.16693715, 1.33302598, ..., 0.37267343, 0.39846954, 0.31916526], [1.03845972, 1.09593668, 1.38717273, ..., 0.45731671, 0.33916127, 0.36123309]]]) - strain_energy(time, y, x)float640.0006125 0.00126 ... 7.51e-05
array([[[ 6.12452093e-04, 1.25999243e-03, 1.53274578e-03, ..., 1.50418948e-03, 1.08596538e-03, 1.19458666e-03], [ 1.64210214e-04, 1.15224553e-03, 1.56336117e-03, ..., 1.33581178e-03, 8.63745123e-04, 6.82897303e-04], [-6.02752038e-05, 4.26235411e-04, 9.31464499e-04, ..., 1.33191425e-03, 9.70292919e-04, 5.62278200e-04], ..., [ 1.07388138e-03, 1.04731926e-03, 1.53363075e-03, ..., -3.87339177e-05, 2.16473906e-04, -6.28522517e-06], [ 8.85654531e-04, 1.03371921e-03, 1.51717637e-03, ..., 1.21631005e-04, 1.28957413e-04, 4.66117308e-05], [ 7.82051649e-04, 1.26313033e-03, 2.13590083e-03, ..., 1.87189562e-05, 1.27547939e-04, 7.50967113e-05]]]) - nba_ac(time, y, x)float1280.934 0.8649 ... 0.7849 0.6873
array([[[0.93403981, 0.8649224 , 0.90696701, ..., 0.92115827, 0.93931132, 0.95967838], [0.87231986, 0.9527269 , 0.9065734 , ..., 0.91878744, 0.92619165, 0.97904306], [0.94182722, 0.98787188, 0.92147086, ..., 0.96248644, 0.95012377, 0.99452372], ..., [0.94623443, 0.99237643, 0.98956207, ..., 0.86196649, 0.84717119, 0.95741829], [0.95268264, 0.98810612, 0.9882685 , ..., 0.65843739, 0.69693291, 0.8790063 ], [0.9717657 , 0.98881812, 0.98663928, ..., 0.93219685, 0.78488922, 0.68725373]]], dtype=float128) - npr_ac(time, y, x)float1280.06595 0.1351 ... 0.2151 0.3127
array([[[0.06595326, 0.13507657, 0.09303275, ..., 0.07882891, 0.06067204, 0.04027601], [0.12768013, 0.04727308, 0.0934238 , ..., 0.0812124 , 0.07380825, 0.02095688], [0.05817272, 0.01212727, 0.07851326, ..., 0.03751328, 0.04987614, 0.00547621], ..., [0.05366455, 0.00747106, 0.01026563, ..., 0.13803337, 0.15282877, 0.04258171], [0.04727084, 0.01185383, 0.01169737, ..., 0.34156229, 0.30306696, 0.12099368], [0.02816772, 0.01104692, 0.01279831, ..., 0.06780271, 0.21511072, 0.31274623]]], dtype=float128) - npy_ac(time, y, x)float1286.92e-06 1.029e-06 ... 4.254e-08
array([[[6.92026060e-06, 1.02884815e-06, 2.39052501e-07, ..., 1.28166223e-05, 1.66367551e-05, 4.56062820e-05], [7.27777064e-09, 2.45312343e-08, 2.80313619e-06, ..., 1.53878675e-07, 1.00437493e-07, 5.78362597e-08], [6.24815247e-08, 8.48928163e-07, 1.58838195e-05, ..., 2.76520789e-07, 9.08157342e-08, 7.80237752e-08], ..., [1.01015957e-04, 1.52507765e-04, 1.72306316e-04, ..., 1.43433913e-07, 4.04637094e-08, 1.20100051e-10], [4.65121667e-05, 4.00477758e-05, 3.41256854e-05, ..., 3.15367948e-07, 1.23766570e-07, 2.13111642e-08], [6.65773180e-05, 1.34963256e-04, 5.62403247e-04, ..., 4.38218768e-07, 5.55959341e-08, 4.25405396e-08]]], dtype=float128) - ba_ac(time, y, x)float1288.428e-05 0.0001343 ... 1.403e-05
array([[[8.42803238e-05, 1.34338746e-04, 2.71379601e-04, ..., 2.37498459e-04, 1.94133044e-04, 2.64638953e-04], [2.18222958e-05, 3.25165767e-04, 2.56384631e-04, ..., 2.20877617e-04, 1.39809320e-04, 2.94323229e-04], [2.58226519e-05, 3.96209275e-04, 1.67891695e-04, ..., 4.40565856e-04, 2.42187295e-04, 6.24086376e-04], ..., [1.65600003e-04, 6.50346895e-04, 1.01574892e-03, ..., 1.61449697e-05, 3.09905698e-05, 2.71743183e-05], [1.56463402e-04, 6.13460594e-04, 1.19133619e-03, ..., 8.92639630e-06, 1.00725034e-05, 1.37219594e-05], [2.11654604e-04, 6.49963907e-04, 1.00405853e-03, ..., 4.47034327e-05, 2.35618458e-05, 1.40316846e-05]]], dtype=float128) - pr_ac(time, y, x)float1285.951e-06 2.098e-05 ... 6.385e-06
array([[[5.95109805e-06, 2.09799358e-05, 2.78369464e-05, ..., 2.03241353e-05, 1.25394515e-05, 1.11064303e-05], [3.19409617e-06, 1.61343061e-05, 2.64208339e-05, ..., 1.95235599e-05, 1.11414099e-05, 6.30012729e-06], [1.59495687e-06, 4.86392808e-06, 1.43050901e-05, ..., 1.71712258e-05, 1.27134666e-05, 3.43644447e-06], ..., [9.39180624e-06, 4.89610719e-06, 1.05372850e-05, ..., 2.58541897e-06, 5.59066537e-06, 1.20859283e-06], [7.76350572e-06, 7.35939158e-06, 1.41009303e-05, ..., 4.63053952e-06, 4.38011024e-06, 1.88880373e-06], [6.13504722e-06, 7.26129307e-06, 1.30242706e-05, ..., 3.25147422e-06, 6.45747899e-06, 6.38535112e-06]]], dtype=float128) - py_ac(time, y, x)float1286.244e-10 1.598e-10 ... 8.686e-13
array([[[6.24429274e-10, 1.59799503e-10, 7.15284811e-11, ..., 3.30445717e-09, 3.43841690e-09, 1.25762953e-08], [1.82063564e-13, 8.37251227e-12, 7.92744457e-10, ..., 3.69926202e-11, 1.51611143e-11, 1.73869315e-11], [1.71309411e-12, 3.40482627e-10, 2.89402682e-09, ..., 1.26573854e-10, 2.31490020e-11, 4.89617034e-11], ..., [1.76787508e-08, 9.99448880e-08, 1.76866070e-07, ..., 2.68657332e-12, 1.48021253e-12, 3.40878908e-15], [7.63890460e-09, 2.48634553e-08, 4.11377716e-08, ..., 4.27542438e-12, 1.78875063e-12, 3.32683544e-13], [1.45008163e-08, 8.87132263e-08, 5.72332550e-07, ..., 2.10147494e-11, 1.66895249e-12, 8.68551754e-13]]], dtype=float128) - dist2GB(y, x)float640.0 0.0 0.0 0.0 ... 0.0 0.0 0.0 0.0
array([[0., 0., 0., ..., 0., 0., 0.], [0., 1., 1., ..., 1., 1., 0.], [0., 1., 2., ..., 2., 1., 0.], ..., [0., 1., 2., ..., 2., 1., 0.], [0., 1., 1., ..., 1., 1., 0.], [0., 0., 0., ..., 0., 0., 0.]]) - dist2TJ(y, x)float641.0 0.0 1.0 2.0 ... 2.0 1.0 0.0 1.0
array([[1.        , 0.        , 1.        , ..., 1.        , 0.        ,
        1.        ],
       [0.        , 0.        , 1.        , ..., 1.        , 0.        ,
        0.        ],
       [1.        , 1.        , 1.41421356, ..., 1.41421356, 1.        ,
        1.        ],
       ...,
       [1.        , 1.        , 1.41421356, ..., 1.41421356, 1.        ,
        1.        ],
       [0.        , 0.        , 1.        , ..., 1.        , 0.        ,
        0.        ],
       [1.        , 0.        , 1.        , ..., 1.        , 0.        ,
        1.        ]])
- unit :
- millimeters
- step_size :
- 0.15
- path_dat :
- /home/chauvet/Documents/GitToolboxs/pyCraFT/Exemple/data/CI02_539x495_micro.vtk
- simu_time :
- 09.20000000e+04
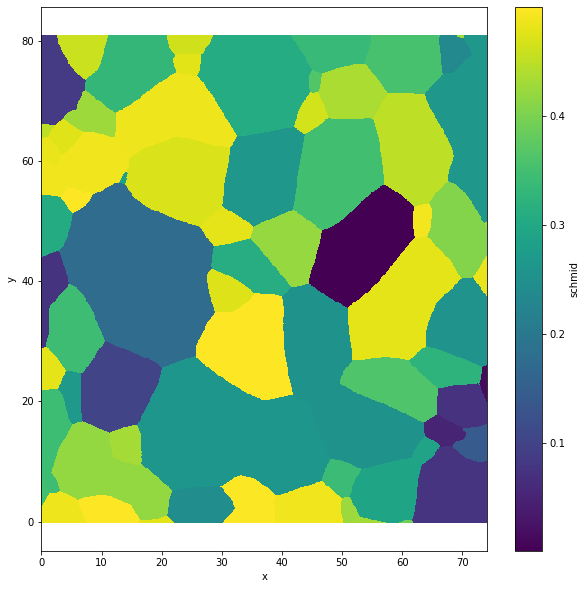
ds['schmid']=ds.orientation.uvecs.calc_schmid(np.array([0,1,0]))
plt.figure(figsize=(10,10))
ds.schmid.plot()
plt.axis('equal')
(-0.075, 74.17499999999998, -0.075, 80.775)
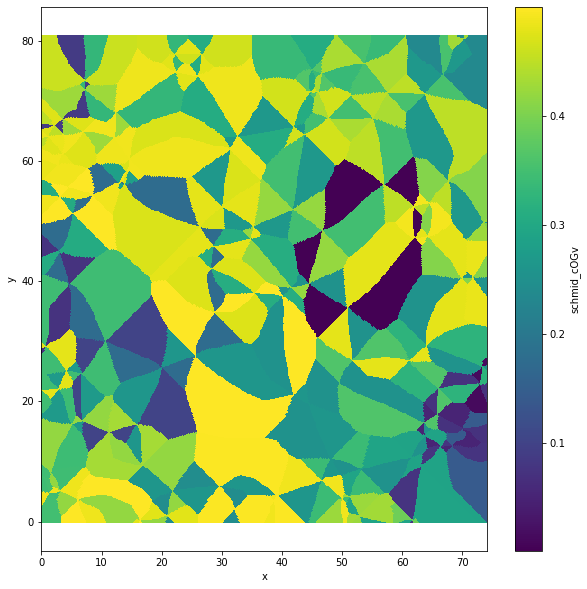
ds['schmid_cOGv']=ds.aita.closest_outG_value(ds.schmid)
plt.figure(figsize=(10,10))
ds.schmid_cOGv.plot()
plt.axis('equal')
(-0.075, 74.17499999999998, -0.075, 80.775)
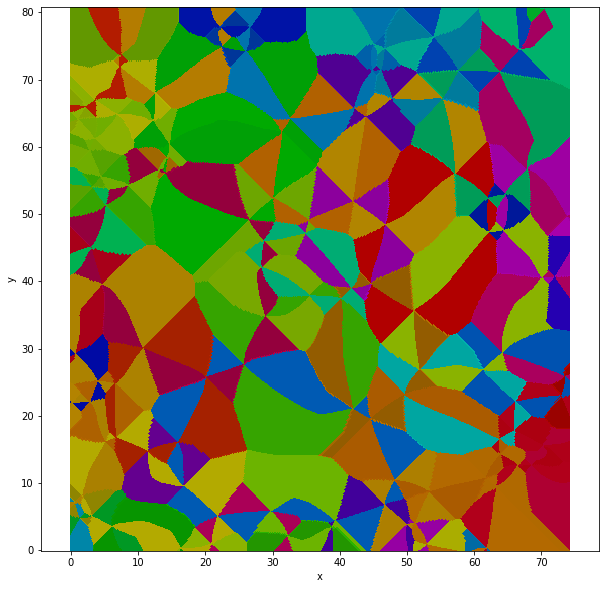
ds['orientation_cOGv']=ds.aita.closest_outG_value(ds.orientation)
ds['cmap_semi_cDGv']=ds.orientation_cOGv.uvecs.calc_colormap(semi=True)
plt.figure(figsize=(10,10))
ds.cmap_semi_cDGv.plot.imshow()
plt.axis('equal')
(-0.075, 74.175, -0.075, 80.775)
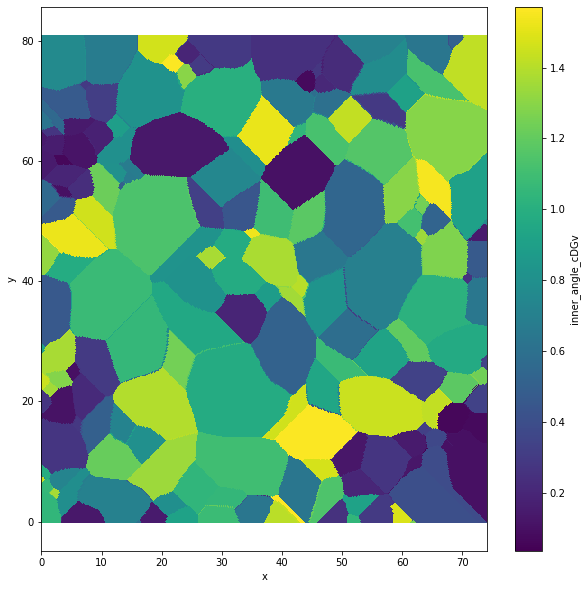
ds['inner_angle_cDGv']=ds.orientation.uvecs.inner_angle(ds.orientation_cOGv)
plt.figure(figsize=(10,10))
ds.inner_angle_cDGv.plot()
plt.axis('equal')
(-0.075, 74.17499999999998, -0.075, 80.775)