
Pixels classification conclusion
3.3. Pixels classification conclusion#
Regrouping the results of cross validation of the different models applied on this dataset, we can compare them on the ROC curve represented Figure 3.20. Models presented in previous sections are placed here in comparison to simples models considering only distance to grain boundary (GB threshold) or distance to triple junction (TJ threshold) and thresholding to determine classes. Unfortunately, this figure make light on the fact that our models are not better predictors that a simple threshold on distance to GB or TJ. The difficulty of classification was already visible on PCA (see Principal Components Analysis (PCA)) with the nearly random distribution of RX pixel into non-RX. In addition, we saw that best models predicted as RX every triple junction whereas in true labels, not all are recrystallized.
At this point of the study, we chose to change the strategy of classification. RX pixels appearing mostly around triple junction, we decided to try to build another dataset to classify triple junction instead of pixels to try to identify triple junction characteristics which lead to a recystallization around it. This new dataset is described section Triple jonctions dataset for tabular data learning. In the following of this idea, we built also a dataset to use Convolution Neural Network (see Triple jonctions dataset for convolutional and mixture Artificial Neural Network learning).
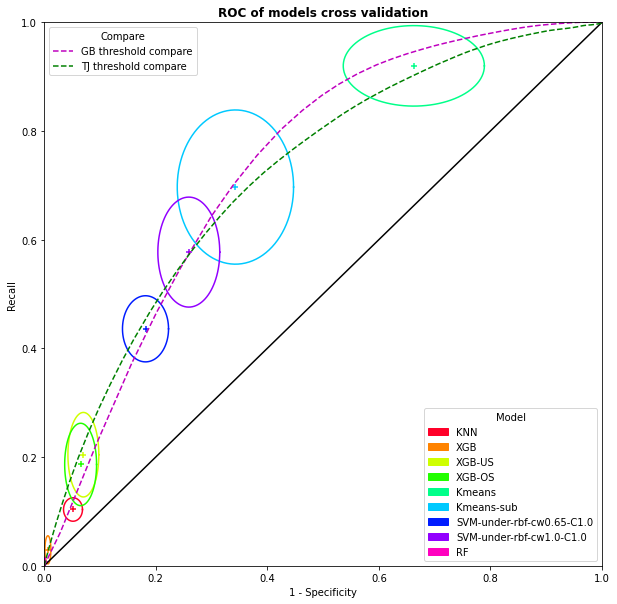
Fig. 3.20 ROC curve rerouping mean and standard deviation values of cross validation of model applied on the pixel dataset and a comparison with models looking only at distance to grain boundary by threshold and same for distance to triple junction.#